Local authorities: what are the challenges posed by energy bills and how can they be solved?
The law on Energy Transition encourages local authorities to to develop optimization strategies, the majority of which have their basis in efficiency
Global warming is consistently driving up the risk of drought to the point where active monitoring of water resource trends has become essential. From groundwater levels to watercourse flow rates and rainfall, the EMI app designed by the experts at Saur Group specialist ImaGeau looks at a broad spectrum of these and similar data to extract practically applicable indicators.
The Explore 2070 project run by the French Ministry of Ecological Transition and Solidarity between 2010 and 2012 predicts that if greenhouse gas emissions and climate change continue at the same rate as today, average annual river flow rates will fall by up to 40% and the amounts of water flowing annually into water tables to top up groundwater levels will be at least 10% lower. Compared with a baseline reflecting the years between 1961 and 1990.
So to limit drought risks within their areas, local authorities will have to make the transition to active management of their water resources. This will mean not only monitoring water resource trends, but also optimizing the way their catchment areas work and forecasting their maintenance needs by using systems such as the EMI (Environmental Monitoring Interface) app developed by Saur Group specialist company ImaGeau.
More than 120 local authorities in France already use this service for a number of purposes, including forecasting drought risks.
Every day, the EMI app collects data from sensors installed in groundwater production facilities or on river banks, as well as rainfall data and other historical and statistical data available from government servers:
These validated and verified numbers are used by the app’s algorithms to calculate vulnerability indicators for a given location, with particular emphasis on drought forecasting. EMI also provides information on hydraulic structure efficiency and clogging to provide a clear overview of water resource trends within a given area, which can then be used as the basis for implementing the measures required to optimize performance.
In practical terms, EMI flags up those hydraulic structures that are performing below their required level. It could, for example, identify that a borehole has a maintenance issue that should be corrected as quickly as possible, because against a background of drought risk, it could result in the local authority losing some of its water supply capacity.
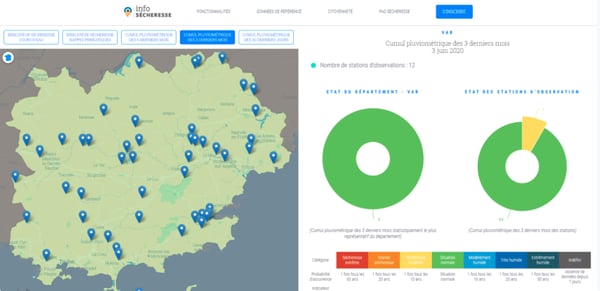
The data generated by all monitoring points for a particular water table or watercourse can also be viewed to check the current water level relative to its historic high and low points. This capability makes it possible to generate continuous estimates of water resource trends, and the level of vigilance to be applied to individual water tables or watercourses. The same principle applies to the rainfall metrics sourced from the nearest weather recording stations.
By collating all the relevant data, the EMI app produces thirty risk indicators, which are updated daily for each defined area. It therefore alerts local authorities to changes in drought conditions in real time. It also describes the potential impact of these conditions on water production.
EMI gives local authorities the opportunity to literally view things as they happen, and therefore to save significant quantities of water and achieve valuable savings on system maintenance costs.

The law on Energy Transition encourages local authorities to to develop optimization strategies, the majority of which have their basis in efficiency
Find out how EMI Patrimoine help local authorities with a solution that uses all the available environmental data to develop plans to ensure security...
Riventa is a solution for measuring the true efficiency of pump systems as the basis for reducing their high level of energy consumption.